Using the fC Tool for Deforestation and Forest Degradation
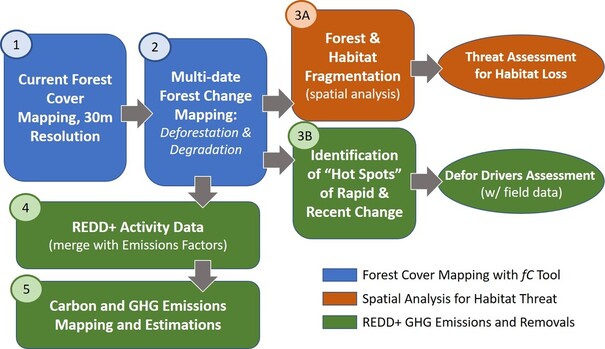
The fC Tool is a remote sensing-based spatial analysis of forest cover changes, that can be used to support REDD+ activities under the framework of a National Forest Monitoring System. I can also support biodiversity management, particularly objectives related to habitat fragmentation analysis and threat assessments. The figure to the left presents the dat and information flow for both REDD+ carbon monitoring and habitat conservation management. These functions are describe more below. At the end we have a demo video.
Using the fC Tool for REDD+ Forest Carbon Management
The fC Tool is a remote sensing based system that uses 30 meter resolution data to map forest condition, initially developed for carbon monitoring in the REDD+ framework, but with capabilities for habitat and conservation objectives. It was used recently for this broad application for the Brazilian Amazon, covering the entire region with spatial maps at 30 m resolution for a 25 year timeframe. These results are published in the journal Science, which is linked here.
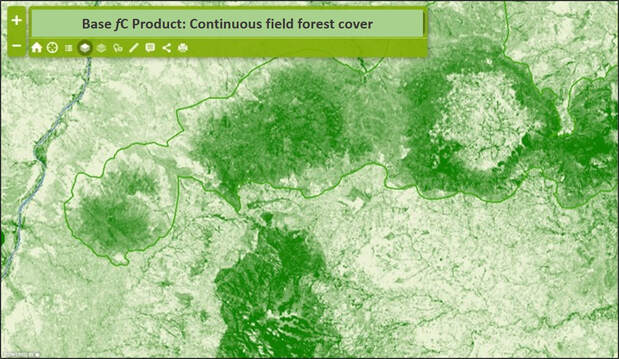
The fC tool uses freely available remote sensing data of forest cover extent, degradation, deforestation and reforestation. This is a necessary component of REDD+ MRV for producing Activity Data. fC is used for measurement of forest baselines and Forest Reference Emission Levels. As shown in the figure to the left, the continuous field of forest density values can monitor changes from forest to non-forest or changes within forest, hence it can quantify degradation of forests -- or habitat -- for a range of applications. It was primarily developed for REDD+ to quantify extreme cover changes (deforestation) as well as the gradient of change with canopy for degradation of carbon stocks or habitat degradation.
It is deployed in conjunction with field plots from a national forest inventory (NFI) to compute GHG emissions and removals. The tool produces a robust, continuous field product that maps and quantifies degradation as well as deforestation which has been challenging for most countries. It can also be used for non-carbon forest management and policy applications such as biodiversity – it uses spatial data so it can map habitat status and threat and evaluate forest fragmentation.
In Liberia, for example much of the remaining Western Chimpanzee habitat is not protected land and is surrounded by other land uses. Thus, there is a need for tool like fC that can measure threats, cover large areas (region) of scattered habitats, covers areas where ground observation and enforcement is lacking (e.g. non protected land) and where fragmentation is as important as deforestation in determining habitat health.
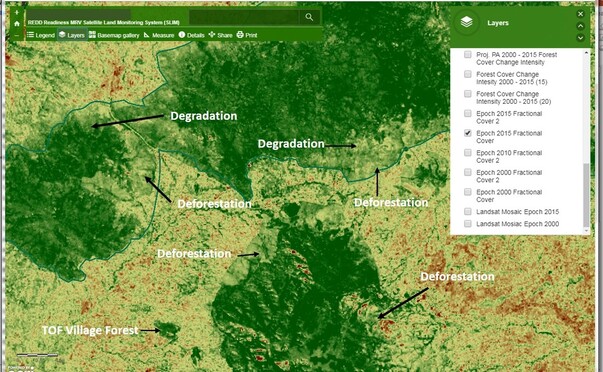
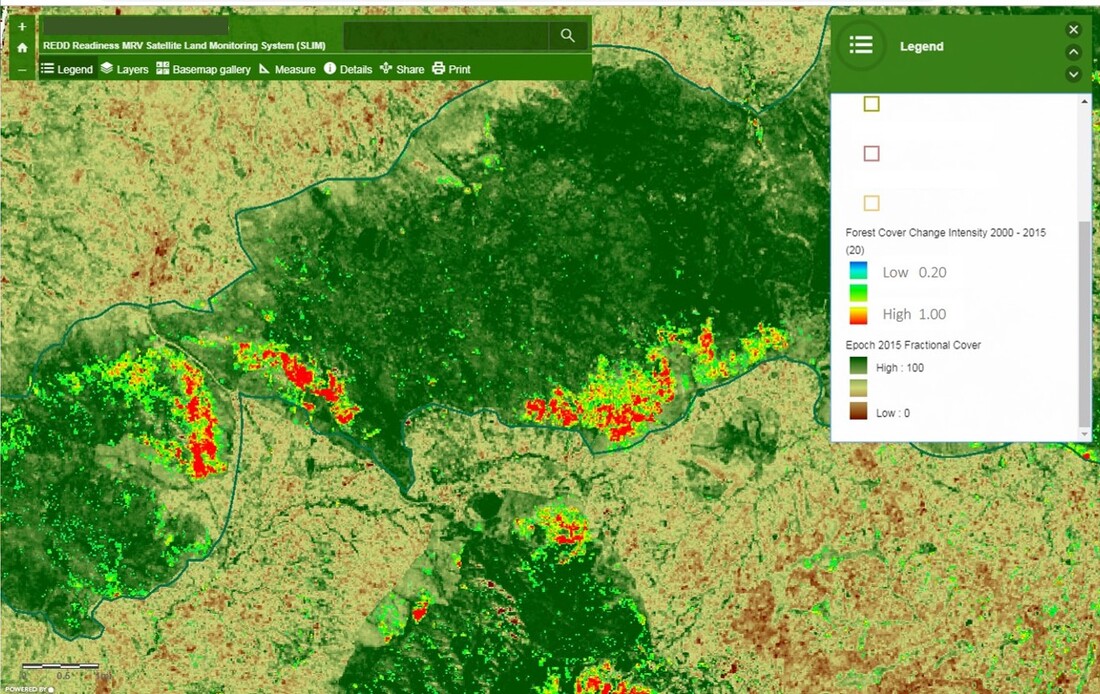
The examples below show the fC application. The figure on the left shows the mapping of forest cover, as well as small forests in village or agricultural landscapes. Deforestation and degradation are mapped using multi-date datasets. The figure on the right demonstrates how the magnitude and intensity of forest cover change produces a robust mapping of degradation across a gradient from low intensity degradation (yellow to green shades) to complete loss of forest (red).
|
|
Using the fC REDD+ Tool for Habitat Analysis
Because biodiversity is a key co-benefit of low carbon forest management, it is important that the tools for carbon management integrate well with other forest and conservation management objectives. The fC Tool is a spatial analytical framework. This is important for a range of scientific and policy needs, from inventorying emissions associated with edge effects to managing water and energy balance mediated by the size of disturbances to mitigating habitat fragmentation and isolation. The figure on the right shows the spatial framework of the mapping of standing forests, where the Tool maps edges, isolated forests, and other features as well as identifying standing but degraded forests. Using multi-date analysis, it is possible to evaluate threatened habitat. The spatial monitoring capabilities can then identify and support targeted enforcement and interventions.
Brief Demo Video From USAID Malawi
Overview of the MRV Tool for REDD+ Field Data
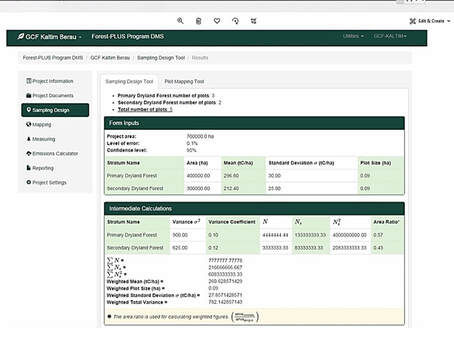 The MRV Tool Sample Size Estimator
All REDD+ programs and projects need to develop or tie into a National Forest Monitoring System that consists of three "pillars": 1) A Satellite Land Monitoring System (SLMS) which is described above, 2) A National Forest Inventory System which is described here, and 3) A GHG Emissions and Removals Accounting System. Our MRV Tool provides the online toolkit to create these "pillars". Activity Data on rates and extend of deforestation and forest degradation are provided using remote sensing and our fC Tool. The MRV Tool provides all the data management, sample frame development, and carbon computation tools for forest carbon inventory. A handheld smart app provides an extension of the online cloud-based platform to data collection in the field, and supports community based carbon measurement. Below is a video demo of the MRV Tool.