The fC Tool for Tracking Forest Degradation for Charcoal
Description for Charcoal Impact Mapping
Effective reduction in deforestation and forest degradation due to wood harvesting for charcoal production requires a close examination of the forest areas that are impacted or threatened, and an evaluation of their status prior to and after deployment of A2C interventions. In part this involves the spatial and quantitative analysis of biomass loss attributed charcoal collection. In practice this has been a challenge on three fronts: 1) this is a spatial problem that requires change mapping over landscapes nationwide or in large priority regions of Miombo woodlands, 2) the spatial quantification of forest biomass loss in Miombo woodlands of Zambia is difficult due to its dispersed and sparse nature; rather than being a problem of deforestation, which is the complete conversion of forests, this requires quantification of the intensity of biomass loss within forests, and 3) the attribution and tracing of observed biomass loss to supply chains for charcoal markets needs to be made. The MSU team members have been leading the successful deployment of specific tools for this type of analysis in several East and Southern Africa countries that have notable charcoal-driven biomass loss and forest degradation in woodlands. For example, these tools have been effectively used to support forest degradation mitigation interventions supporting national REDD+ programs in Malawi and demonstrations for Zambia.
The tools are based on the use of low cost (most often free) moderate resolution satellite remote sensing images at 30 meters spatial resolution covering large areas or nationally. The remote sensing tool, called the fC tool (fractional cover tool) uses an end member spectral mixture model to produce a continuous field product. Rather than mapping discrete forest types, it relies on measures of forest canopy fractions (fC) to map biomass density and change in density over time. Using change detection between two or more dates of observation, the approach quantifies changes in fC values, which represent biomass loss within forests, or forest degradation. This approach contrasts with deforestation mapping, often done using image classification which can only map changes from forest to non-forest. The fC Tool can detection deforestation as well. The examples shown in Figures 1 and 2 were produced for the Government of Malawi.
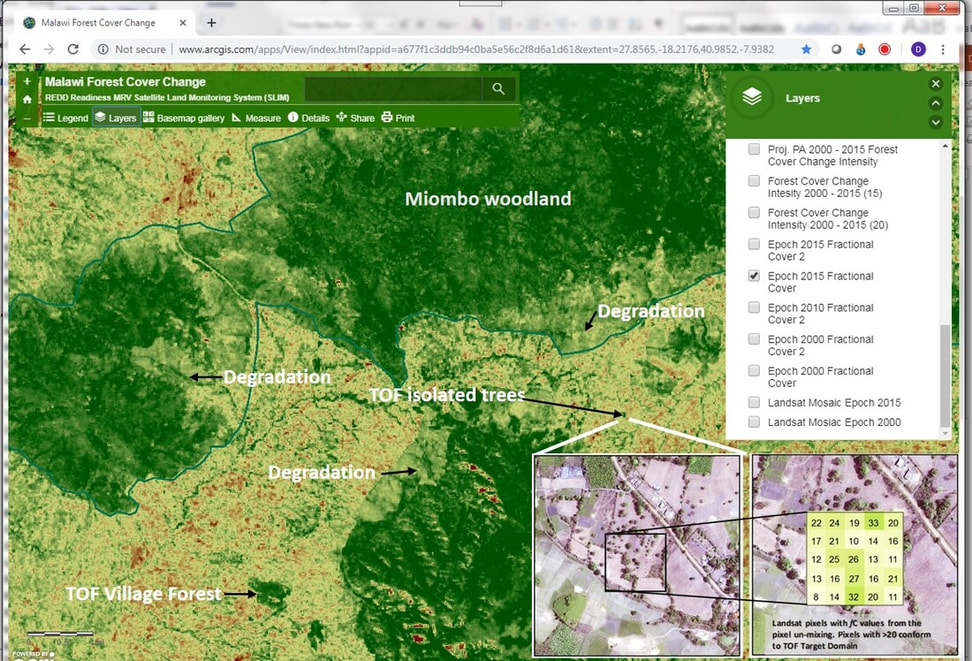
Figure 1. Mapping of forest degradation in Miombo using the fC Tool. This analysis is based on Landsat remote sensing using spectral mixing models that delineate intact forest, continuous degrees of forest degradation as well as trees outside of forests as clusters of scattered trees or woodlot blocks.
Figure 1. Mapping of forest degradation in Miombo using the fC Tool. This analysis is based on Landsat remote sensing using spectral mixing models that delineate intact forest, continuous degrees of forest degradation as well as trees outside of forests as clusters of scattered trees or woodlot blocks.
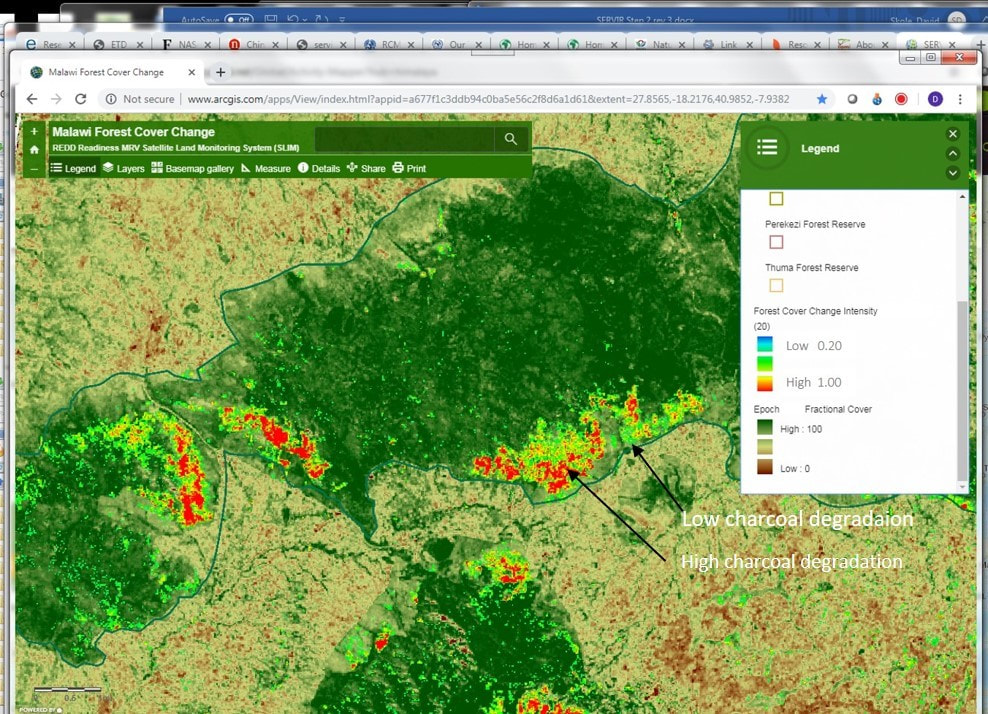
Figure 2. Using multiple dates a change detection algorithm provides spatial and quantitative measures of forest degradation intensity, which is directly proportional to the amount of biomass removed and the GHG emissions. Red is higher intensity biomass removals, greens are lower intensity biomass removals.
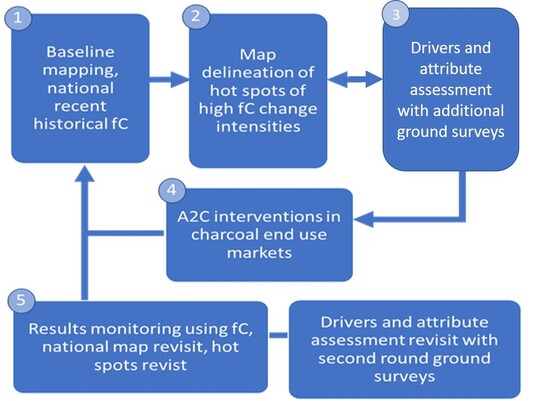
The national coverage using the fC tool provides a baseline of forest conditions at an initial point in time. Changes are mapped between two or more points in historical time to produce a change intensity mapping, as shown in Fig. 2. Because the change intensity is continuous over a range from 0.0 to 1.0 it can discriminate between high intensity hot spots and low-grade degradation locations. A hot spot analysis then identifies areas of highest concern or, perhaps, priority areas for interventions. Although the entire map of all levels of intensity provide the overall baseline for results monitoring, the hot spots are key targets areas. First, they are used in results monitoring as strong indicators, while the overall map ensures that any leakage is also detected if it exists. Second, the hot spots provide a focal point for analysis of attribution. For this household surveys and focus groups on the ground in hot spot villages can be used to identify areas of important charcoal extraction of woody biomass.
An important additional challenge is that charcoal biomass extraction may also occur in clusters of trees outside of forests (ToF) in rural or agricultural landscapes, in addition to forests. Most emphasis by governments and development partners has been to focus on the official recorded forest area (RFA), while considerable biomass enters the markets from ToF systems outside of the RFAs. The same fC tool is used across the entire landscape, thus documenting a more complete picture of charcoal impact (see Fig.1 markers).
Video description with full details